Linux Performance Observability Tools
I am learning about Linux Performance Tools and I found Brendan Gregg's talks on Linux Performance are very interesting.
There are so many performance tools for Linux. Brendan recommends to follow a performance analysis methodology to analyze system or application performance. These methodologies can guide us to choose and use these performance tools effectively.
There are different types of command line tools available in Linux. In this blog post, I'm going to focus on Linux Performance Observability Tools. I highly recommend to watch Brendan's talk at Velocity 2015 on Linux Performance Tools and I took details about following tools from his presentation and his website.
Here are some examples of using Linux Performance Observability Tools in Ubuntu. I tested each of these commands in a Ubuntu Trusty Vagrant Box
There are so many performance tools for Linux. Brendan recommends to follow a performance analysis methodology to analyze system or application performance. These methodologies can guide us to choose and use these performance tools effectively.
Linux Performance Observability Tools
There are different types of command line tools available in Linux. In this blog post, I'm going to focus on Linux Performance Observability Tools. I highly recommend to watch Brendan's talk at Velocity 2015 on Linux Performance Tools and I took details about following tools from his presentation and his website.
 |
| Linux Performance Observability Tools Taken from Brendan Gregg's Website: http://www.brendangregg.com/Perf/linux_observability_tools.png |
Here are some examples of using Linux Performance Observability Tools in Ubuntu. I tested each of these commands in a Ubuntu Trusty Vagrant Box
Basic Observability Tools
# Print load averages
uptime
# System and per-process interval summary.
# It's important to note that the top can miss short-lived processes.
# See 30 Linux TOP Command Examples With Screenshots
top
# htop is an interactive process viewer and you need to install it.
sudo apt-get install htop
htop
# Process status listing
ps -ef
# ASCII art forest
ps -ef f
# Virtual Memory Statistics
vmstat
# Show stats in Megabytes and update every second
vmstat -SM 1
# Block I/O (disk) stats. The iostat tool is in 'sysstat' package.
sudo apt-get install sysstat
iostat
# Display extended statistics in megabytes per seconds.
# This also shows device utilization and omits the inactive devices
# during the sample period.
iostat -xmdz 1
# Report multi-processor statistics.
mpstat
# per-CPU stats
mpstat -P ALL 1
# Main memory usage in megabytes.
free -m
Intermediate Observability Tools
# Trace system calls and signals. This is not recommended in production.
strace
# Trace system calls in a process.
# Prints the time (us) since epoch (-ttt) and syscall time (-T).
# Need to use sudo to attach to the process.
sudo strace -tttT -p 3344
# Sniff network packets for post analysis.
# Using sudo to get permissions to capture packets on device
sudo tcpdump -i eth0 -w /tmp/out.tcpdump
# Read the dump
sudo tcpdump -nr /tmp/out.tcpdump
# Print network connections. See 10 basic examples of linux netstat command
netstat
# Network statistics by protocol
netstat -s
# Show both listening and not-listening sockets
netstat -a
# Show listening sockets
netstat -l
# Show the PID (-p) and the name of the program for TCP sockets (-t)
netstat -tp
# Kernel IP routing table
netstat -r
# Kernel Interface table
netstat -i
# Print network traffic statistics. You need to install 'nicstat' package.
sudo apt-get install nicstat
nicstat
# Process Stats
pidstat
# Process Stats by thread
pidstat -t
# Process Stats by disk I/O
pidstat -d
# Show swap usage
swapon -s
# Show swap usage in verbose mode
swapon -v
# List open file. Can be used as a debug tool
lsof
# Show active network connections
lsof -iTCP -sTCP:ESTABLISHED
# System Activity Reporter.
# Before using sar, we need to enable data collection.
# See:
# Simple steps to install and configure sysstat/sar on Ubuntu/Debian server
# 10 Useful Sar (Sysstat) Examples for UNIX / Linux Performance Monitoring
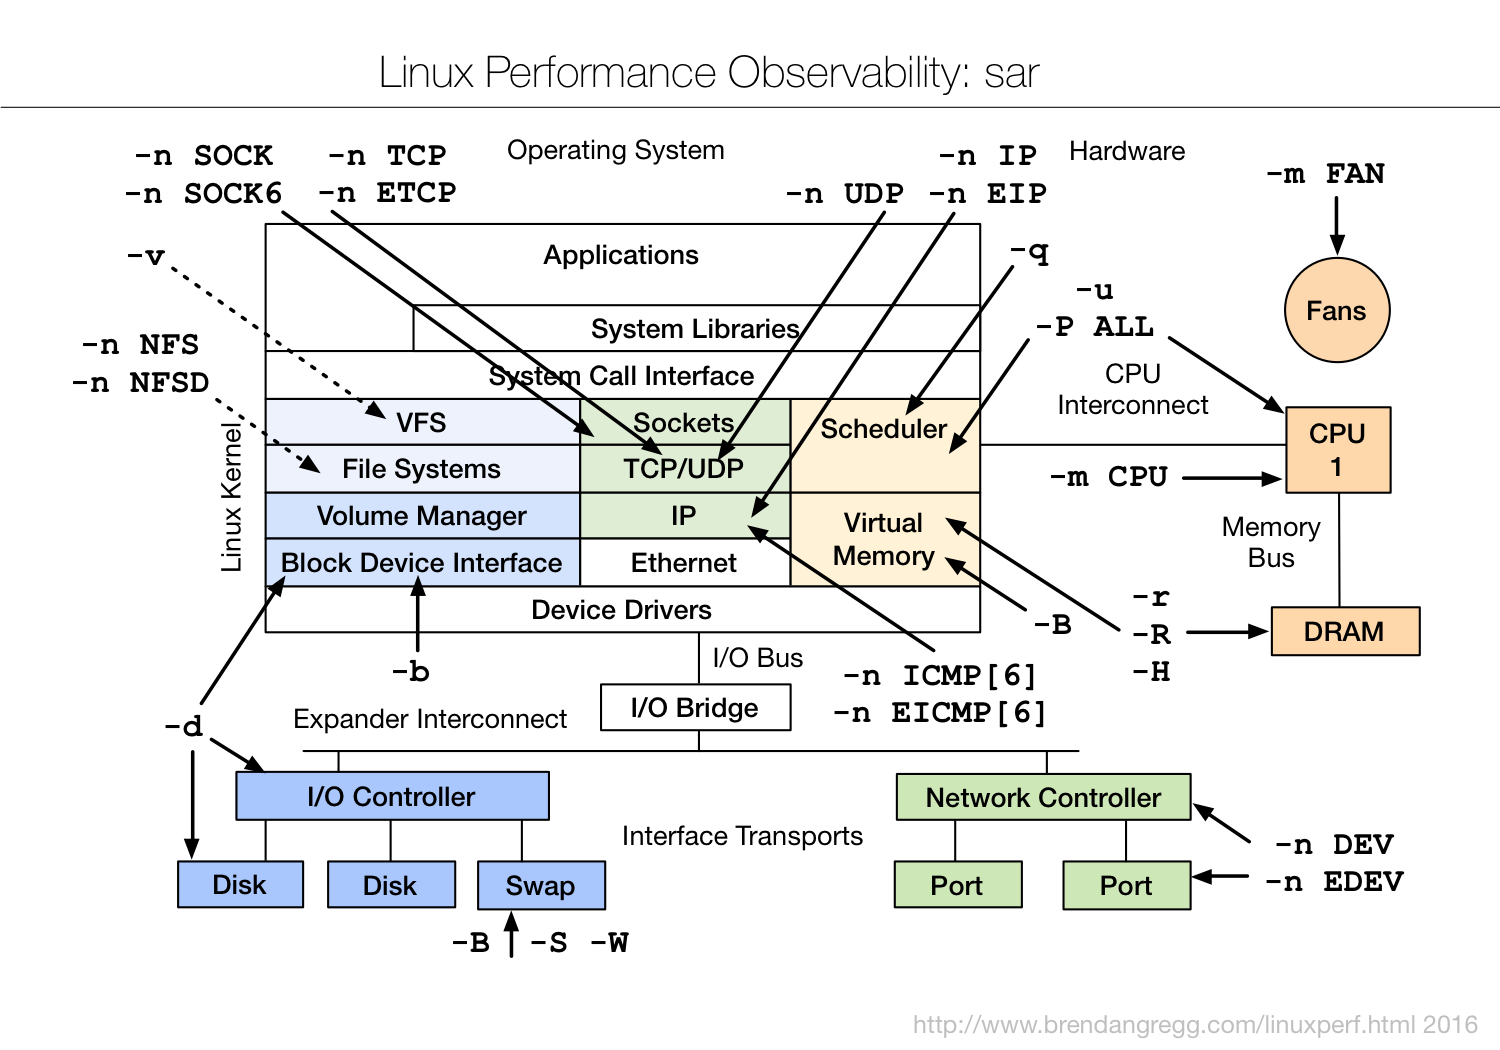
sar -q
 |
| Linux Performance Observability: sar Taken from Brendan Gregg's Website: http://www.brendangregg.com/Perf/linux_observability_sar.png |
Advanced Observability Tools
# Socket Statistics. This is similar to netstat,
# but it can display more TCP and state informations than other tools.
ss
# Socket Statistics. Show timer, processes and memory
ss -mop
# Show internal TCP information
ss -i
# Interactive Colorful IP LAN Monitor
sudo apt-get install iptraf
sudo iptraf
# Monitor I/O. A top-like tool
sudo apt-get install iotop
sudo iotop
# Kernel slab allocator memory usage
sudo slabtop
# Page cache statistics.
# This tools is available in GitHub: https://github.com/tobert/pcstat
# and we need to use Go to build it.
# You can also download a binary from GitHub. Refer README for more information.
./pcstat testfile
# perf_events: Linux profiling with performance counters.
# This tool needs to be installed.
# I used perf command in previous blog post about Java CPU Flame Graphs.
# See Brendan's Linux Perf Examples.
# Perf Tutorial is also good resource to learn about perf.
sudo apt-get install linux-tools-common linux-tools-generic
# List perf event
sudo perf list
# tiptop: reads hardware performance counters
# and displays statistics about running processes, such as IPC, or cache misses.
# This tool was not available in Ubuntu 14.04 package repositories.
# Therefore I tried it on Ubuntu 15.04
sudo apt-get install tiptop
tiptop
# The rdmsr command reads a Model-Specific Register
# (MSR) value from the specified address.
# This tools is available from "msr-tools" package.
sudo apt-get install msr-tools
# Brendan has developed some Model Specific Register (MSR)
# tools for Xen guests (eg, AWS EC2).
# Reading CPU temperature:
sudo rdmsr -p1 -f 23:16 -d 0x1a2
Summary
This blog post lists some Linux Performance Observability Tools. I have also linked man pages and some examples of using the tools.
As I mentioned, Brendan's presentations have more details on these tools and I just wanted to list those in one page for my own reference.


Comments